Fair Value Gap Trading Strategy for Gold: XAU/USD Guide
- afaq anser35
- Business
- 2026-11-03 20:07:18
- 1428K
Gold rarely moves quietly. A single inflation report or Fed comment can push XAU/USD by twenty dollars in minutes. As a result, price often leaves behind areas where buying and selling were badly out of balance. These areas are called fair value gaps, and they are among the most useful zones a gold trader can study.
A fair value gap trading strategy builds trades around these imbalances. Put simply, you wait for price to return to the gap, then trade in the direction of the original move. Over the years, many gold traders have found this approach more precise than drawing wide support and resistance bands.
In this guide, you will learn what a fair value gap is, how to identify a fair value gap on a gold chart, and how to tell a bullish and bearish fair value gap apart. Moreover, you will get clear rules for entries, stops, and targets, plus the risk habits that keep this method sustainable.
What Is a Fair Value Gap?
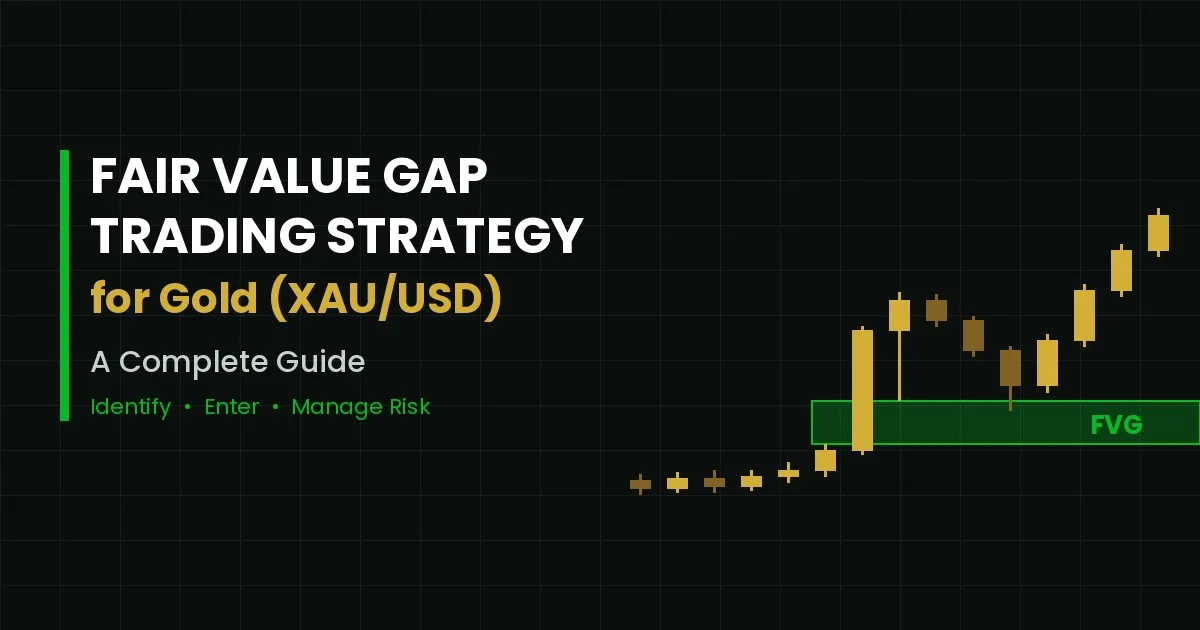
A fair value gap (FVG) is a three-candle pattern that shows an imbalance in price. It appears when one large candle moves so fast that the wicks of the candles on either side of it do not overlap.
Think of it this way. During a strong move, aggressive buyers or sellers overwhelm the other side. Consequently, price skips over a range where little two-way trading took place. That empty range is the gap.
Markets tend to revisit these inefficient areas. Large participants who could not fill their full orders during the spike often wait for price to come back. In addition, traders who missed the move see the gap as a fair place to enter. When price returns, it rebalances the zone, and the original trend frequently resumes.
The concept is popular in Smart Money Concepts (SMC) and ICT-style trading. However, you do not need to follow any single school to use a fair value gap trading strategy. At its core, an FVG is simply a visible footprint of urgency in the market.
Why the Fair Value Gap Trading Strategy Suits Gold
Gold has several traits that make FVGs especially clear. First, XAU/USD reacts sharply to U.S. economic data such as CPI, Non-Farm Payrolls, and Federal Reserve decisions. These releases create the fast, one-sided candles that produce gaps.
Second, gold is highly liquid during the London and New York sessions. Because of this, institutions can push price aggressively, and they often return later to fill remaining orders. That behaviour tends to respect FVG zones.
Third, gold trends well once a direction is set. A fair value gap trading strategy works best in trending conditions, since gaps act as pullback entry points within the trend.
That said, gold is also volatile. A wick of several dollars through your zone is common. Therefore, position sizing and stop placement matter more on gold than on slower pairs such as EUR/USD.
How to Identify a Fair Value Gap on a Gold Chart
Learning how to identify a fair value gap takes only a few minutes. Spotting high-quality ones, on the other hand, takes practice. Follow these steps on any timeframe.
- Find a strong displacement candle. Look for a candle with a large body that is clearly bigger than the candles around it. This is the middle candle of the pattern.
- Check the candle before it. Mark the high of candle one in an up move, or its low in a down move.
- Check the candle after it. Mark the low of candle three in an up move, or its high in a down move.
- Confirm there is no overlap. If the wicks of candle one and candle three do not touch, the space between them is your fair value gap.
- Draw the zone. Extend a rectangle forward in time so you can see when price returns.
Not every gap deserves attention, though. Strong FVGs on gold usually share a few qualities:
- They form during London or New York hours rather than the quiet Asian session.
- They appear right after price breaks a recent swing high or low.
- They are created by news-driven or session-open momentum.
- They are visible on higher timeframes, such as the 1-hour or 4-hour chart.
Here is a simple example with hypothetical levels. Gold breaks above a prior high after strong data. The candle before the breakout has a high of 4,000, and the candle after it has a low of 4,008. The 4,000 to 4,008 range is a bullish FVG that may act as support on a pullback.
Bullish and Bearish Fair Value Gap Explained
Every FVG has a direction. Knowing the difference between a bullish and bearish fair value gap tells you which side of the market to favour.
Bullish fair value gap. A bullish FVG forms during a strong upward move. The gap sits between the high of the first candle and the low of the third candle. When price falls back into this zone, it often meets buyers. As a result, traders look for long entries inside the gap.
Bearish fair value gap. A bearish FVG forms during a sharp drop. The gap lies between the low of the first candle and the high of the third candle. When price rallies back into it, sellers often return. Consequently, traders look for short entries there.
There is one more nuance worth knowing. Sometimes price closes fully through an FVG instead of reacting to it. In that case, the gap has failed. Some traders then treat the zone as an inverse FVG, where former support becomes resistance, and vice versa. In practice, a failed gap is often an early sign that the trend is shifting.
A simple rule keeps things clear: trade a bullish and bearish fair value gap only in the direction of the higher-timeframe trend. Use bullish gaps in uptrends and bearish gaps in downtrends.
A Step-by-Step Fair Value Gap Trading Strategy for XAU/USD
The framework below is a practical starting point. Test it on historical charts before you risk real money.
Step 1: Set the Bias on a Higher Timeframe
Start on the 4-hour or daily chart. Is gold making higher highs and higher lows, or lower highs and lower lows? This trend sets your direction for the day, so only take setups that agree with it.
Step 2: Mark Key Liquidity Levels
Next, note the previous day's high and low, plus the Asian session range. Gold often sweeps one of these levels before making its real move. A gap that forms right after such a sweep tends to be more reliable.
Step 3: Find the FVG on an Entry Timeframe
Then drop to the 15-minute or 5-minute chart. Wait for a displacement candle in the direction of your bias that leaves a clean gap.
Step 4: Wait for the Retracement
Patience matters here. Do not chase the breakout candle. Instead, set an alert at the edge of the gap and let price come back to you.
Step 5: Choose Your Entry
Traders usually pick one of three entry styles:
- Enter at the first touch of the gap for more trades but less confirmation.
- Enter at the 50% level of the gap, often called consequent encroachment.
- Wait for a lower-timeframe rejection candle inside the gap before entering.
On gold, the 50% entry is a popular middle ground. It offers a better price while still respecting the zone.
Step 6: Place the Stop-Loss
For a long trade, place the stop a few dollars below the low of the first candle or below the swing low that started the move. For a short trade, place it above the matching high. Always allow extra room for gold's spread and sudden spikes.
Step 7: Set Your Targets
Aim for the nearest opposing liquidity, such as a recent swing high in a long trade. Alternatively, use a fixed reward-to-risk ratio of at least 1:2. Many traders take partial profit at 1:1 and then move the stop to breakeven.
Risk Management for Gold FVG Trades
Even the best fair value gap trading strategy will produce losing trades. What separates consistent traders is how they manage risk.
First, risk no more than 1% of your account on a single trade. Because gold moves in larger dollar amounts, calculate your lot size from the stop distance rather than from habit. A fifteen-dollar stop needs a much smaller position than a five-dollar stop.
In addition, be careful around high-impact news. Spreads on XAU/USD can widen sharply during releases, and stops can be skipped entirely. For this reason, many experienced traders stay flat for a few minutes before and after major data.
Finally, keep a trading journal. Record the timeframe, session, entry type, and outcome of each FVG trade. After fifty or more trades, patterns will emerge that no guide can teach you.
Common Mistakes to Avoid
Traders who are new to this method tend to repeat the same errors. Avoiding them will save you both money and frustration.
- Trading every gap. Small gaps form constantly on low timeframes, and most of them are noise. Focus on gaps that follow real displacement.
- Ignoring the trend. A bullish FVG inside a strong downtrend is more likely to fail than to hold.
- Using tight stops. Gold regularly wicks a few dollars beyond a zone before reversing. A stop placed exactly at the gap edge is easily hit.
- Keeping filled gaps on the chart. Once price has fully traded through a gap, it has lost most of its value. Remove it to keep your chart clean.
- Skipping backtesting. Rules feel obvious in hindsight. Testing them on past data shows whether they actually hold up.
Final Thoughts
The fair value gap trading strategy gives gold traders a structured way to read imbalance and time their entries. Once you know how to identify a fair value gap and can separate a bullish and bearish fair value gap, your charts become far easier to read. Still, no single pattern guarantees profits. Combine FVGs with trend analysis, sound risk management, and steady practice for the best results.
Many traders also pair their manual analysis with charting indicators that highlight possible setups. Before relying on any such tool, it is sensible to research it carefully, and questions like "is GainzAlgo legit" are a natural part of that process. GainzAlgo is one of several indicator providers that traders evaluate in this way. Whichever tool you consider, read independent reviews, test it on a demo account, and treat its signals as a second opinion rather than a replacement for your own judgment.
1428 people like this


About Premium Author
This post has been authored and published by one of our premium contributors, who are experts in their fields. They bring high-quality, well-researched content that adds significant value to our platform.